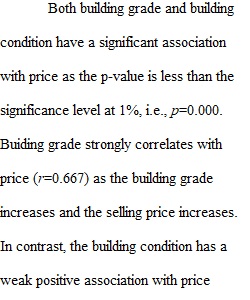
Q This week’s SPSS task goes into more detail on standard multivariate regression. Watch the following videos and complete the problems below. You’ll want to have SPSS active as you watch these and open “Deliveries_example4.sav” file from Canvas module 4 so that you can follow along for the first three videos. Note that the property value data set is the one that we will be using for the Quantitative data project report. Open a word processing document to save your work and then submit it to Canvas. Label each answer with the problem number below. Be sure that you are saving your work within the Horizon window. (Note that some of these speak somewhat slowly, so if you want to set the YouTube playback speed to 1.25, that may be still workable.) Statistics 101: Multiple Linear Regression, The Very Basics https://www.youtube.com/watch?v=dQNpSa-bq4M (Links to an external site.) Statistics 101: Multiple Linear Regression, Evaluating Basic Models https://www.youtube.com/watch?v=wPJ1_Z8b0wk (Links to an external site.) Statistics 101: Multiple Linear Regression, Evaluating Basic Models Continued https://www.youtube.com/watch?v=px72eCYPuvc (Links to an external site.) Interpreting Output for Multiple Regression in SPSS https://www.youtube.com/watch?v=WQeAsZxsXdQ (Links to an external site.) 1. Using the Deliveries_example4.sav data, copy and paste the SPSS model summary and coefficients table into your document from the following simple regressions (3 points) 1. Travel time (dependent) on miles (independent), then of 2. Travel time (dependent) on number of deliveries (independent), then of 3. number of deliveries (dependent) on miles (independent).. 2. Using the KCHousing_2014_2015.sav data that is on Canvas Module 4 for #2-#5 here, copy and paste scatterplots and the SPSS model summary and coefficients table with confidence intervals into your document from the following simple regressions (3 points) 1. Price (dependent) on Building Condition (independent) 2. Price (dependent) on Building Grade (independent) 3. Which of the two independent variables in #2 appears to have a clearer association with price? Explain how you came to that conclusion. Based on a correlation matrix between the two variables, would it be safe to include both in a regression with price as the dependent variable? Explain the basis for your conclusion and include a copy and paste of the correlation matrix. (3 points) 4. Run a regression of price on both Building Condition and Building Grade including the options for descriptives and confidence intervals. Copy and paste the model summary and interpret in words the calculated adjusted r-squared for this regression. Copy and paste the coefficients table including the confidence intervals. Interpret in words the meaning of the confidence intervals for this specific problem and these specific variables. (3 points) 5. Copy and paste the correlation matrix for the following 7 variables into your document. Comment on what variables appear to be more strongly associated and what variables don’t appear to be strongly associated. Do any of the pairs of variables look like they might cause problems of multicollinearity? Explain your conclusion. (3 points) 1. Bedrooms 2. Bathrooms 3. Square feet of finished living space 4. Lot size 5. Building condition 6. Building grade 7. Year built
View Related Questions